
Where’s there’s data, there’s a story. And at Sift Science, using tetrabytes of data from billions of transactions to find useful fraud signals and patterns (aka, exposing the complex story behind fraud) is our bread and butter. For example, if you’re a shoe store we could potentially tell you whether people who order size 9 shoes are more likely to be fraudsters than people ordering size 11.
We wondered: Where is most fraud happening in the U.S.?
Sometimes, we want to see if our data can help us tell an even larger story about fraud trends, patterns, and behaviors. Our investigations often start with a simple question, like the one above. And soon, that single query blossoms into many related questions, such as:
- Are certain regions more likely to have fraud?
- Does fraud correlate with whether a state votes Republican or Democrat (red or blue, based on voting in the 2012 Presidential election)?
- Do any other types of crime correlate with online fraud?
- Do urban areas have a higher fraud rate?
We looked at all this – and did a bit more analysis about who’s committing fraud and how they’re doing it – to produce our United States of Fraud report.
Digging into the data
To get answers to these questions, we focused on a year’s worth of data (August 2014 – August 2015), taking a sample of 1.3 million transactions with shipping or billing address in the U.S. We computed the fraud rate as the number of fraud users as a fraction of all users.
Shipping addresses reflect where physical goods are being shipped. In some cases, these are the addresses of reshippers, and the goods end up in a different location. In others, it’s the location where the fraudster is based.
Billing addresses reflect the information that’s been filled in to validate the credit card transaction. In many cases, this reflects stolen information that’s been purchased online; in other words, it’s the billing information of the victim whose card was stolen. Other times, it reflects information the fraudster inputs to try their luck, since they don’t possess the actual billing info.
Fraud by region
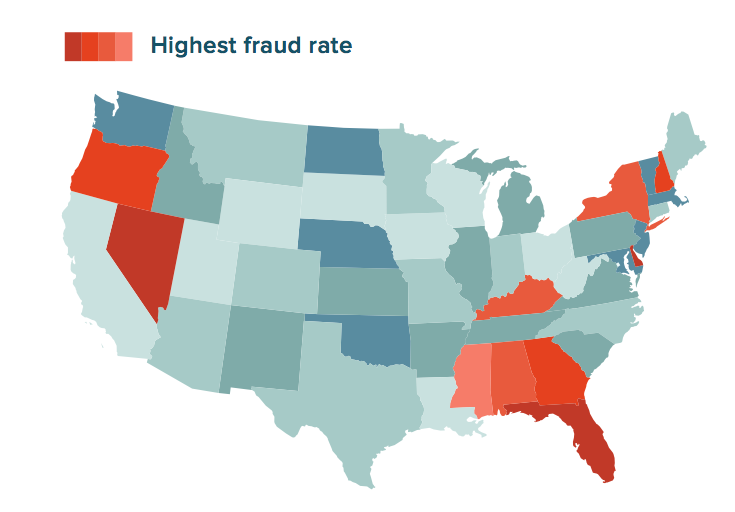
Defining a “region” can be a bit controversial, so we relied on divisions from the U.S. Census. Looking broadly, our data revealed the lowest rate of fraud – in terms of both shipping and billing address – happens in the Midwest. However, Massachusetts had the overall lowest rate of fraud based on shipping, and the second-lowest based on billing.
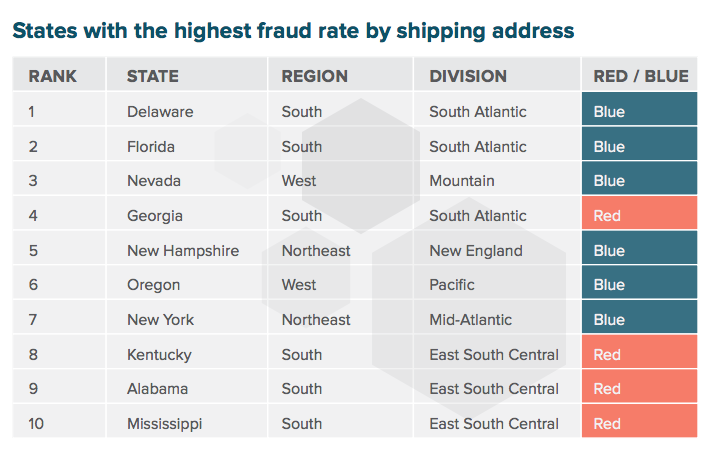
And the highest rate of fraud? We found that the South was highly represented among our top 10 states with the highest fraud rate based on shipping address. And both the South and West showed up frequently when we looked at fraudulent billing addresses.
Where fraudy orders are shipped
Our analysis found that most fraudulent orders are being shipped to the Atlantic coast, and Miami-Dade County in Florida had the highest rate of fraud relative to all other counties in the U.S. We’ve also noticed this pattern in the past, even investigating why Doral, Florida is such a fraud hotspot and reasoning that its proximity to an airport and port, plus its thriving logistics industry probably have a lot to do with it.
Where fraudy goods are billed
Overall, billing addresses located in the West were more likely to be fraudulent than those in any other region. Alaska – the the state listed first in checkout form dropdown lists – showed up at the top.

It’s worth noting that while it was interesting to factor in political leanings with our analysis, we didn’t find a correlation between online fraud (either by shipping or billing address) and whether a state votes Democrat or Republican.
Online vs. offline crime
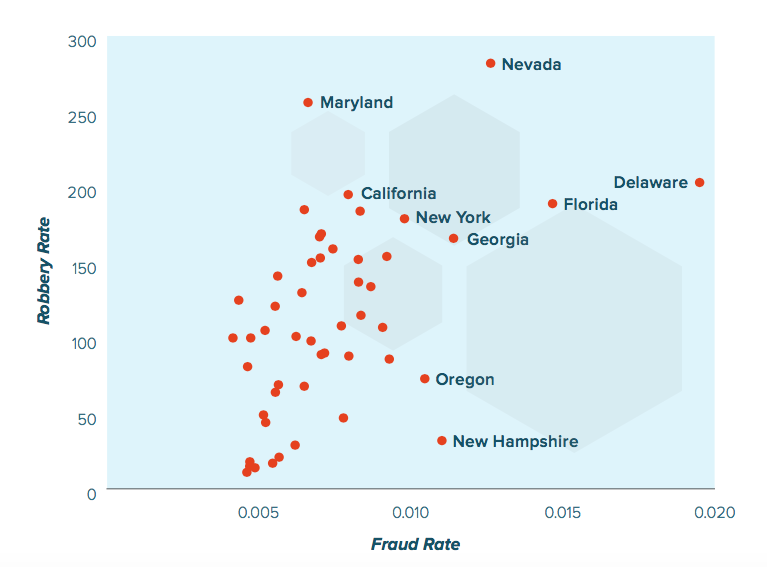
We wondered whether crime that happened virtually would have any relationship with crime that happened in real life. Here’s what we found:
- Nevada, Delaware, and Florida all ranked highly for both robbery and online fraud.
- Nevada also has the second-highest unemployment rate in the nation
- We didn’t find a correlation between online fraud and any other type of crime
Urban areas and fraud
When you imagine fraud rings, you might think of criminals hovering around a computer in a gritty urban setting. We wondered: were cities really more likely to be hubs for shady behavior, or were fraudsters hiding in less populated areas?
Our research found that contrary to what we might assume, orders shipped to urban areas were no more likely to be fraudulent than the average order.
- Miami, New York City, Los Angeles, and Philadelphia all show a higher than average fraud rate
- However – San Francisco, Boston, Dallas, and Chicago have lower fraud rates than average
Among the top 20 cities with the most fraud (by shipping address), there were several with mid-sized populations, including:
- Elkhart, Indiana (pop. 50.949) had a higher fraud rate than Indianapolis, Indiana (pop. 829,718)
- Saginaw, Michigan (pop. 50,303) had a higher fraud rate than Detroit, Michigan (pop. 713,777)
- Westminster, California (pop. 91,739) had a higher fraud rate than Los Angeles, California (pop. 3.8 million)
Want to know more? You can download the full United States of Fraud report, or tune in next week for Part II: The Fraudiest Behavior in America.